UI & data visualization
We design and create user interfaces and advanced visualizations for data of all kinds, so as to guarantee agile and interactive use, multiplying the value and usability even in complex contexts. In this way it is possible to manage data and develop maps, movement flows and performance graphs.
UI & data visualization
What do we do
We target companies, organizations and institutions that want to create or improve their web applications, data analysis platforms or dashboards to visualize and interact with complex data.
Our goal is to provide web applications with well-designed UIs and advanced data visualization tools to enable users to explore, analyze and interpret data more efficiently and effectively. This can be useful in a wide range of industries, including business, finance, health, scientific research and more, to make informed, data-driven decisions.
- Development of graphic user interfaces (GUI)
- Geolocalized data management
- Interactive data exploration
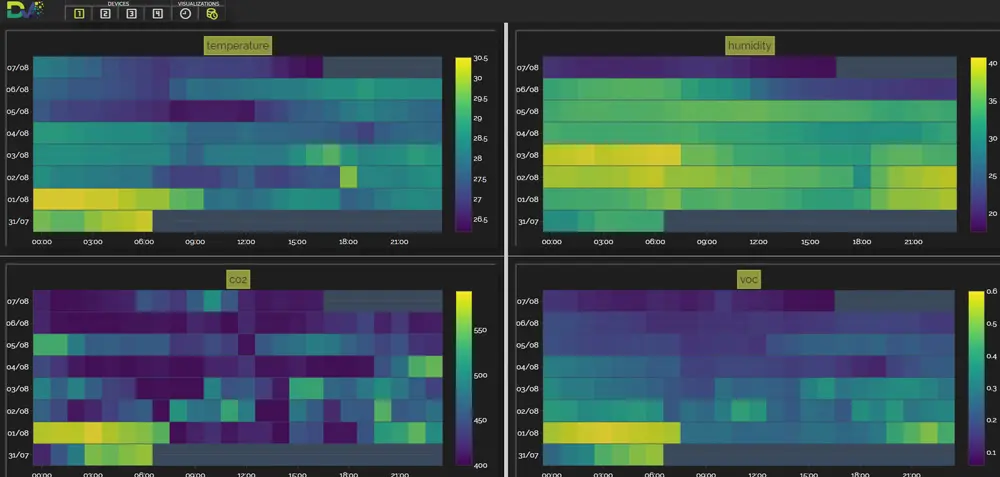
- Dashboarding and 2D charts for reporting
How we work
Requirements Analysis
We start with an in-depth analysis of the customer’s needs. We understand the specific objectives of the application, the target audience and the available data sources.
User Interface (UI) Design
We design an intuitive and professional user interface that allows users to interact with the application easily. This phase can include designing layouts, icons, navigation, and workflows.
Front-End Software Development
We use front-end web technologies such as HTML, CSS and JavaScript, along with frameworks such as React, Angular or Vue.js, to create the user interface. We also implement data visualization tools such as 2D charts, interactive maps, custom dashboards and data exploration capabilities.
Data Integration
We integrate data from different sources, including databases, APIs, IoT and web services, into the application. We ensure that the data is accurate, up-to-date and easily accessible.
Customization
If necessary, we allow users to customize the interface or reports to suit their needs. This may include creating filters, custom queries, and display options.
Performance Optimization
We optimize the web application to ensure fast loading times and smooth response to user interactions.
Testing and Quality Control
We carry out extensive testing to ensure that the application works properly on a variety of devices and browsers.
Training and Support
We provide training to your organization’s staff and provide ongoing technical support to ensure effective use of the application.
Maintenance and Updates
We provide regular maintenance, bug fixes, and make improvements based on user feedback and evolving needs.
Documents
An analytical approach,
for timely solutions
contact area